Enterprise Data Visualization Tools
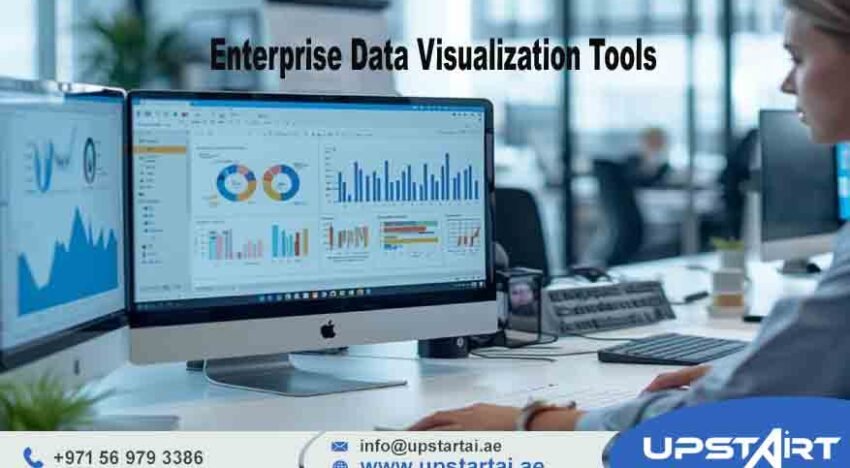
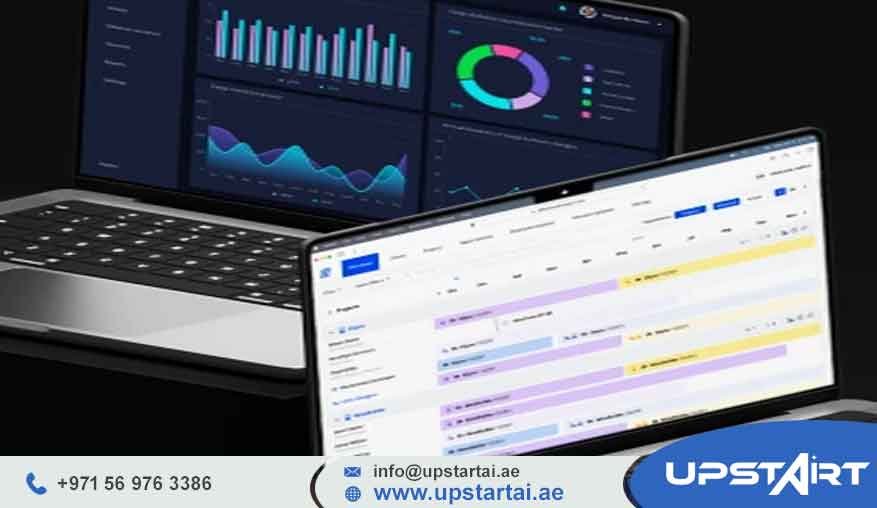
Enterprise Data Visualization Tools Built for Scalable, AI-Driven Decision Making. At Upstart AI, we help large organizations across the UAE make sense of complex data and actually use it with confidence. Our enterprise-grade data visualization tools turn raw numbers into clear, practical insights that decision-makers can act on right away. With AI-powered analytics dashboards, enterprise BI tools, and corporate data visualization platforms, leadership teams get a real-time view of what’s happening in the business, without guessing or waiting for reports.
We bring hands-on experience in analytics dashboard development, big data intelligence, ERP system development, and AI automation. This means we don’t just show charts and graphs. We help enterprises move away from static reports and disconnected systems and shift toward smart, scalable visualization solutions that grow with the business.
From finance and healthcare to government, retail, manufacturing, and telecom, we work with organizations across Dubai, Abu Dhabi, Sharjah, Ajman, Ras Al Khaimah, and Fujairah. Our focus is fast implementation, practical outcomes, and results you can clearly measure.
Trusted by enterprises looking for reliable analytics, backed by experienced data analysts, AI specialists, proven ERP integrations, and a strong focus on real ROI, not just promises.
Why Enterprise Data Visualization Matters for Modern Organizations
Today’s enterprises generate huge amounts of data from ERP systems, customer platforms, operational tools, and many external sources. Without the right enterprise data visualization software, this data often stays scattered, slow to access, or simply too hard to understand. As a result, decision-makers end up depending on old spreadsheets or static reports that don’t reflect what’s actually happening right now.
Enterprise data visualization tools solve this by turning raw data into interactive dashboards, visual analytics, and role-based reports. Instead of spending hours pulling data together, leadership teams can instantly see key performance indicators, trends, and potential risks. This makes a big difference for organizations that are under constant pressure to work faster, reduce costs, and stay ahead of competitors.
For large organizations in the UAE, especially those operating across multiple locations, scalable data visualization software is no longer a “nice to have”. It becomes the backbone of data-driven strategy, clear operations, and long-term, sustainable growth.
Why Choose Us
Why Enterprises Across the UAE Choose Upstart AI
Enterprises choose Upstart AI because we understand both the technology side and the real business challenges behind it. We don’t just build dashboards and walk away. Our goal is to deliver enterprise analytics software solutions that genuinely improve decision-making, efficiency, and scalability over time.
With teams available locally across the UAE, we offer fast response, clear communication, and a structured implementation process that avoids confusion. Our data analysts, AI developers, and ERP specialists work closely together so analytics solutions always align with business goals, not just technical checklists. Every project focuses on transparency, measurable outcomes, and long-term value, not short-term reporting fixes that break later.
By using enterprise-grade visualization tools, secure data architectures, and proven analytics methods, we help enterprises trust their data and feel confident when making important decisions.
Our AI and Analytics Services
Comprehensive Analytics, ERP, and AI Solutions for Enterprises
Analytics Dashboard Development
We design and build analytics dashboards that give real-time visibility into business performance. Each dashboard is tailored for executives, managers, or operational teams, so everyone sees the numbers that matter to them. These dashboards allow interactive exploration, trend tracking, and drill-down views, making insights faster and easier to find.
Data Analytics and Visualization
Our data analytics and visualization services help enterprises spot patterns, unusual trends, and opportunities hidden inside complex data. By combining analysis with simple visual storytelling, we make data easier to understand and easier to act on across teams.
Big Data Intelligence Solutions
For organizations dealing with large volumes or fast-moving data, we deliver big data intelligence solutions that support advanced processing and visualization. This allows enterprises to analyze operations, customer behavior, and external data sources without slowing things down.
ERP System Development and Integration
We develop and integrate ERP systems that act as a strong and reliable data foundation for enterprise reporting dashboards. By connecting ERP data with analytics platforms, organizations get consistent and accurate insights across finance, operations, supply chain, and HR.
AI Automation for Workflows and Operations
Our AI automation services reduce manual work by automating repetitive tasks like reporting, data preparation, forecasting, and approvals. This helps teams work faster, with fewer errors, and less daily frustration.
Predictive Analytics and Forecasting
We build predictive analytics models that help enterprises plan ahead. These models support demand forecasting, risk identification, and better resource planning, all delivered through easy-to-read visual dashboards.
Business Intelligence Reporting
Our enterprise BI tools for large organizations replace static reports with interactive reporting environments. With self-service BI for enterprises, users can explore data on their own, without waiting for manual reports.
Custom AI-Driven Solutions
When ready-made tools don’t fit the business need, we design custom AI-driven analytics solutions built around specific goals, data structures, and long-term strategies.
These services support startups that are scaling, SMEs looking for better visibility, and large enterprises managing complex operations across multiple departments.
Process and How It Works
Our Proven Approach to Enterprise Data Visualization
Free Consultation and Requirements Gathering
We start with a detailed discussion to understand your business goals, data setup, and reporting challenges. This helps make sure analytics goals match real operational needs from day one.
Data and System Audit
Next, our team reviews existing data sources, ERP systems, and reporting workflows. We identify gaps, data quality issues, and integration needs, which helps us build a strong analytics foundation.
Solution Design and Architecture Planning
We then design a scalable analytics architecture that supports current requirements and future growth. This includes data models, visualization frameworks, security rules, and user access levels.
Implementation and AI Analytics Deployment
During implementation, we build dashboards, connect data sources, and deploy AI analytics models. Our approach minimizes disruption to daily operations while keeping accuracy and performance high.
Testing, Optimization, and Reporting
Before going live, dashboards are tested for accuracy and ease of use. After launch, we continue to optimize based on user feedback and changing business needs, because things always evolve.
Problems We Solve
Addressing the Most Common Enterprise Analytics Challenges
Many enterprises struggle with manual processes that slow down reporting and decision-making. Data often sits in different systems, making it hard to get one clear and reliable view of performance. This leads to delayed insights, forecasting mistakes, and missed business opportunities.
Without proper enterprise reporting dashboards, leadership teams lack visibility into key metrics, which adds stress during planning and reviews. Repetitive reporting tasks eat up valuable time, while older ERP systems make it harder to scale or adapt quickly.
Upstart AI solves these issues by delivering integrated analytics, ERP, and AI automation solutions. We replace manual workflows with intelligent automation, bring data together from multiple systems, and provide real-time data visualization enterprise solutions that support clear, confident Costs and Pricing Insight
Understanding the Cost of Enterprise Data Visualization Solutions
The cost of enterprise data visualization tools depends on several factors, such as the size and complexity of the solution. Organizations working with multiple data sources, large datasets, or advanced AI requirements may need more detailed development and integration.
Pricing is also influenced by customization needs, the number of dashboards and users, and how quickly the solution is needed. In many cases, a phased approach helps enterprises manage budgets while still seeing early results.
Pricing ranges are usually indicative and adjusted based on real requirements. During consultation, we share transparent estimates and explain what affects cost, so there are no surprises later.
Tips and Helpful Advice
Maximizing Value from Enterprise Analytics Investments
To get better results, enterprises should align dashboards with business goals instead of tracking too many metrics. Focus on KPIs that directly impact revenue, cost control, and customer experience.
For ERP implementation, it’s important to handle data consistency and governance early. This avoids reporting issues later on. AI automation works best when applied to high-volume, repetitive tasks where time savings are easy to measure.
ROI from analytics investments can be tracked by faster decision-making, improved efficiency, and reduced manual work. Clear benchmarks make it easier to show long-term value.
Why We Are Number One
What Sets Upstart AI Apart
Our real strength is how we combine enterprise-grade visualization tools with AI automation and ERP expertise. We care about performance improvement, not just delivering dashboards that look good.
Our big data intelligence solutions handle complex analytics needs, while our custom ERP development ensures data stays accurate and consistent. With dedicated consultation and ongoing support, enterprises can keep improving analytics as their business grows.
This practical, results-focused approach makes us a long-term partner, not just another service provider.
Case Studies and Success Stories
Finance Enterprise Analytics Transformation
A regional finance organization faced delayed reporting and data scattered across departments. We implemented enterprise BI tools and real-time dashboards connected to their ERP system. This led to faster reporting, better forecasts, and clearer visibility for executives.
Healthcare Data Visualization for Operational Efficiency
A healthcare provider needed enterprise healthcare data visualization to track operations and resource usage. Our solution delivered role-based dashboards and predictive insights, helping management improve staffing and service quality.
Retail Analytics for Supply Chain Visibility
A retail enterprise struggled with inventory and logistics visibility. We built retail enterprise analytics dashboards and enterprise supply chain visualization tools that improved demand planning and reduced stock-related issues.
Frequently Asked Questions
How long does it take to implement enterprise data visualization tools?
Timelines depend on scope, data complexity, and integrations. Most projects follow a phased approach so early insights are delivered quickly.
Can analytics dashboards integrate with existing ERP systems?
Yes, our solutions are designed to work smoothly with existing ERP platforms for accurate reporting.
Are enterprise analytics dashboards secure?
Security is handled through role-based access, data governance, and secure deployment setups.
What industries benefit most from enterprise data visualization?
Finance, healthcare, government, retail, manufacturing, telecom, and logistics all benefit strongly from advanced analytics.
Do you support self-service BI for enterprises?
Yes, dashboards are designed so users can explore data independently without losing control.
Is AI automation suitable for large organizations?
Yes, especially for organizations with high-volume, repetitive tasks.
How is pricing determined for analytics solutions?
Pricing depends on data size, customization, integrations, and timelines.
Do you offer ongoing support after deployment?
Yes, we provide ongoing optimization and support to maintain long-term value.
Can dashboards be customized for different roles?
Yes, role-based dashboards are built for executives, managers, and analysts.
Do you offer UAE-wide services?
Yes, we support clients across Dubai, Abu Dhabi, Sharjah, Ajman, Ras Al Khaimah, and Fujairah.
Contact and Call to Action
Get Started with Enterprise Data Visualization Today
If your organization is ready to move beyond static reports and finally unlock the real value of its data, Upstart AI is here to help. Our enterprise data visualization tools, AI analytics, ERP development, and automation services are available across the UAE with fast support and experienced teams.
Contact us today by phone, WhatsApp, email, or through our online form to book a free consultation. Let’s build a scalable, intelligent analytics foundation that supports confident decisions and long-term growth.