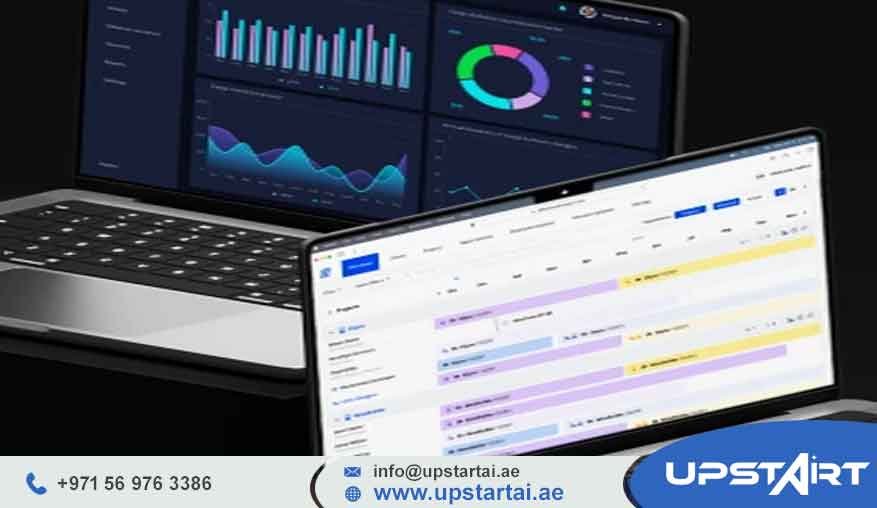
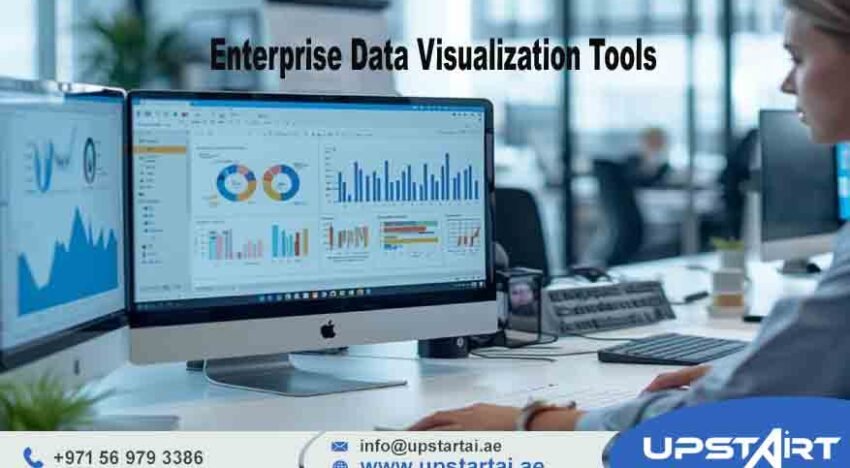
Enterprise Data Visualization Tools
We help leading firms in Dubai and Abu Dhabi turn messy GCC market data into clear, actionable intelligence using custom interactive dashboards. Our technical setups bridge the gap between raw, confusing numbers and the confident decisions executives need to make every day.
Schedule a Free Call Today
Certified Experts | UAE-Wide Clients | ROI-Focused Campaigns | 10+ Years Experience
Bespoke Data Visualization Solutions for the UAE Enterprise Market
In the fast-paced business world of the United Arab Emirates, data is essentially the new currency. But here’s the thing: currency is only useful if you can actually spend it on insights.
Modern Enterprise Data Visualization Tools AT UpsartAI act like a refinery for this raw material. They allow C-suite leaders in the DIFC and across the region to see market shifts as they happen. Without a clear visual layer, massive piles of data from retail, property, and logistics just sit there, gathering digital dust. We build these visual windows so your local market intelligence is always right in front of you.
The rules in the UAE, especially around FTA tax compliance and the Personal Data Protection Law (PDPL), make handling data a bit of a puzzle. Our approach ensures that your dashboard isn’t just a bunch of pretty charts; it’s a secure, legal window into the health of your business. We focus on creating one single version of the truth that handles different currencies and local VAT rules automatically. This means directors and procurement heads can stop worrying about spreadsheet errors and start focusing on the big picture.
Real digital growth means moving away from old, static reports. In the high-stakes world of Abu Dhabi real estate or Dubai’s massive logistics hubs, waiting a week for a report is a massive risk. We build Interactive Data Visualization layers that let you dig deep into the specifics. Whether you need to track a single product in a Jebel Ali warehouse or check the performance of a luxury villa on Saadiyat Island, you can do it instantly. When your team can “talk” to their own data, you create a culture of smart management that is vital for any enterprise looking to scale.
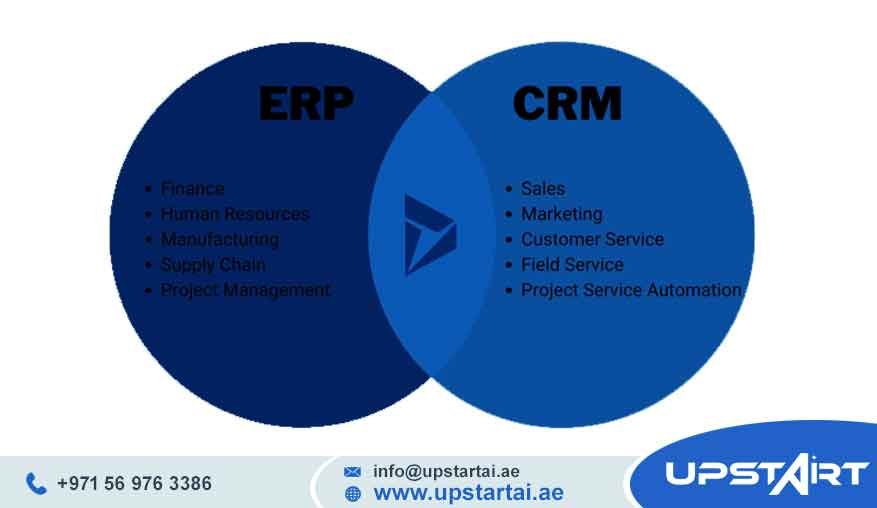
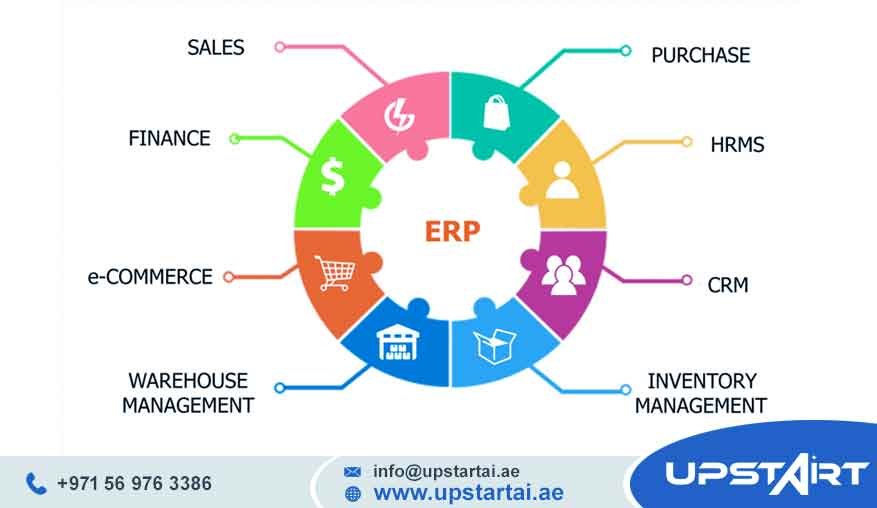
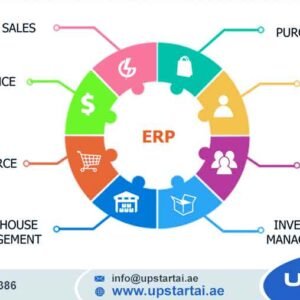
Deep Integration with UAE Business Ecosystems (ERP, CRM, POS)
Think of your dashboard like a tap—it’s only as good as the plumbing behind it. We offer deep integration services that hook your visual tools directly into the systems you already use, like SAP, Oracle, or Microsoft Dynamics. This ensures that when someone makes a purchase in Sharjah or signs a contract in Fujairah, that information pops up on your executive screen immediately.
Strategic AI-Driven Insights Over Generic Charting
Standard charts can show you what happened yesterday, but our AI-powered systems can tell you why it happened. By plugging machine learning models into your visual setup, we catch weird patterns or new trends that a human eye might totally miss. This proactive style turns your data into a prediction engine. It helps you guess what the market wants before your competitors even finish reading their old reports.
Strategic Enterprise Data Visualization Tools Implementation
Turning a mess of scattered data into a clean, unified visual system requires a very disciplined plan. A successful Enterprise Data Visualization Tools rollout always starts with a brutally honest look at the data you have right now. A lot of UAE firms deal with “dirty data”—info that’s doubled up, missing, or stuck in different offices across the Emirates. Our first job is to clean and centralize everything into a high-performance home like Snowflake or BigQuery. This makes sure the foundation of your reports is mathematically solid.
The way your visual system is built needs to match how your company actually runs. A CEO in Abu Dhabi needs a very different view than a manager on the ground in Ras Al Khaimah. We design Data Dashboard Software setups that work for every level of your business. By matching specific goals (KPIs) to the people who actually control them, we cut out the noise. This ensures everyone is looking at the exact numbers that affect their work and your company’s bottom line.
Once the system is built, the real success of any UAE tech project comes down to local support and training. Even the best tools fail if people don’t know how to use them. We provide full training for your staff, making sure they can handle complex filters and pull the right insights for big board meetings. Our Dubai team is always on standby to tweak your systems as you grow, making sure your tech stays just as big as your regional ambitions.
Phase 1: Data Audit & Multi-Source ETL Ingestion
We start by tracing exactly where your data comes from. We look at everything, from old-school SQL databases to modern cloud apps, and build strong “pipes” to move that data. This phase is a lifesaver for UAE companies that have grown by buying other firms and now have a confusing mix of systems that don’t talk to each other.
Phase 2: Custom Dashboard Architecture & KPI Mapping
We don’t do boring, generic templates. During this stage, we sit down with your team leaders to figure out which numbers actually make the needle move. Then, we build custom layouts that put those big goals front and center, using smart design principles so that the most important info is the first thing you see.
Phase 3: Real-Time Deployment & Executive Training
The final launch involves testing everything under real pressure. We make sure your data refreshes as often as you need it—whether that’s every day or every second. Once it’s live, we run hands-on training for your top executives. We show them how to use these tools to find the insights that will lead to their next multi-million dirham decision.
Eliminate Blind Spots with Data Analytics Dashboard Tools
When your data is scattered, efficiency dies. Many companies working across the 7 Emirates find their info is trapped in regional “silos,” making it impossible to see the whole company at once. Using professional Data Analytics Dashboard Tools lets you bridge the gap between your Sharjah, Ajman, and Umm Al Quwain offices. When everything is in one place, you can see where one region is falling behind and move resources to fix it. It’s about making sure every dirham is working as hard as possible.
In the real world, “blind spots” are just missed chances or wasted money. For a logistics company, it might be a bad route that wastes fuel; for a shop, it’s a product sitting in Fujairah while people in Dubai are begging to buy it. High-end Enterprise BI Tools give you the visibility to fix these problems right now. By turning dry numbers into heatmaps and trend lines, we make the invisible visible. This lets your management team step in before a small hiccup turns into a major loss.
Moving from manual Excel sheets to automated visuals is probably the biggest win a CTO can deliver. Building reports by hand isn’t just slow; it’s where human errors creep in—the kind that lead to big mistakes in the boardroom. Automating this whole process saves thousands of hours and keeps your data objective and fresh. This shift turns your analysts from “data janitors” into “data strategists.” They can finally stop cleaning up numbers and start figuring out how to grow the business.
Ending “Data Silos” Between Sharjah and Abu Dhabi Offices
We are experts at bringing data from different locations together. By creating one central cloud home for your info, we make sure your teams in different Emirates are all looking at the same facts. This alignment is huge for keeping your service standards and brand reputation high as you grow across the UAE.
Transforming Raw Big Data into Fast Executive Decisions
Big data is a burden if you can’t use it quickly. Our tools use fast-processing logic to make sure that even if you have millions of rows of data, your dashboard loads in a heartbeat. This speed is vital for “at-the-table” decisions during meetings, where a slow-loading screen can kill the momentum of a big deal.
Automating Manual Excel Reporting to Save 40+ Hours Weekly
Think of it this way: if your smartest analysts are spending all Monday making reports, they aren’t spending that time thinking about how to beat your competitors. Our automation scripts do the heavy lifting, sending out reports to the right people automatically. This return on human talent is usually the biggest “win” of the whole project.
Proven Authority in Enterprise Data Visualization Tools
When you pick a partner for a project this big, you need more than just tech skills—you need regional experience. UpstartAI has spent ten years learning the ins and outs of the Middle Eastern market. We know that Enterprise Data Visualization Tools aren’t just software; they are a key part of your national and international strategy. Our main office in Dubai handles everything for all 7 Emirates, giving you the local touch that global firms often miss.
We take security and legal rules very seriously. We build our systems to go above and beyond what regional regulators ask for. This ensures your sensitive financial or property data is locked down with the best encryption out there. This “security-first” mindset is why so many DIFC finance firms and Abu Dhabi developers trust us. They know they can’t afford a data leak or a legal mistake.
At the end of the day, we only win if you grow. We don’t just hand you a dashboard and disappear; we stay around to make sure your system changes as the market changes. As new tech like Real-Time Data Visualization Tools becomes the norm, we help you add those features to your current setup. This long-term relationship ensures that the money you spend on data today keeps you ahead of the pack for years to come.
Local Support across Sharjah, Ajman, and Fujairah
We don’t just stick to the big cities. We provide hands-on tech support and advice in Ras Al Khaimah, Fujairah, and Umm Al Quwain, too. This means that no matter where your branch is located, you get the same elite level of tech help whenever you need it.
Enterprise-Grade Security for Sensitive Financial & Real Estate Data
We use multi-factor logins and strict access rules for every project we build. This means a luxury developer in Abu Dhabi can show big-picture reports to investors while keeping the nitty-gritty cost details hidden from everyone except the finance team.
Client Success / Case Study
Delivering Custom Data Visualization Solutions for a Dubai Retail Giant One of our favorite recent wins was helping a big retail group with over 50 shops across the UAE. They were dealing with a 48-hour delay in their sales reports, which meant they couldn’t react when a product started flying off the shelves. We set up a unified Real-Time Data Visualization Tools system that brought that delay down to under 15 minutes. In just the first three months, they saw a 35% jump in efficiency because they could move stock between Sharjah and Dubai exactly when it was needed.
Expert Insights on Data Reporting and Visualization
Are Cloud-Based Data Visualization tools secure for UAE government data?
In the real world, security for government data is handled through local servers or special “sovereign” clouds right here in the UAE. We make sure your Business Intelligence Visualization Tools live on tech that follows NESA and TDRA rules. This gives you the ease of the cloud while following the strict laws about keeping sensitive data inside the country.
How do Data Analytics Dashboard Tools integrate with my current ERP?
We make this happen through secure “plumbing” like APIs or direct database hooks. Most modern Data Dashboard Software is built to play nice with others, so it can pull data from different places without you needing to buy all new IT gear. We handle the whole move to make sure your business doesn’t stop for a single second.
What is the ROI of Advanced Data Visualization Software for real estate?
For property firms in Abu Dhabi and Dubai, the profit comes from better leads and faster building times. By seeing your “sales funnel” right next to your construction goals, you can see exactly where you’re losing buyers or wasting money on a project. Most firms see a 20-25% improvement in how they spend their money within the first year.
Can your Enterprise Data Visualization Tools handle multi-language (Arabic/English) data?
Yes, our systems are built specifically for the UAE. We create dashboards that read from Right-to-Left (RTL) for Arabic, as well as English. This makes sure every stakeholder can read the data in the language they’re most comfortable with. This is a must for companies that need to report to both local boards and global investors.
Start Your Journey with Modern Data Reporting and Visualization
In 2026, standing still is the most expensive thing a UAE company can do. While your rivals in Dubai and Abu Dhabi use Enterprise Data Visualization Tools to dominate the market, sticking to old-school reports is a huge risk to your future. The cost of being blind to your own business is much higher than the investment it takes to finally see clearly.
Contact UpstartAI Headquarters: Dubai, UAE
Phone: +971 569763386
Email: info@upstartai.ae
Website: www.upstartai.ae