Smarter Data Visualization for Companies S

Smarter Data Visualization for Companies
Business Intelligence Dashboards That Actually Help You Decide Better
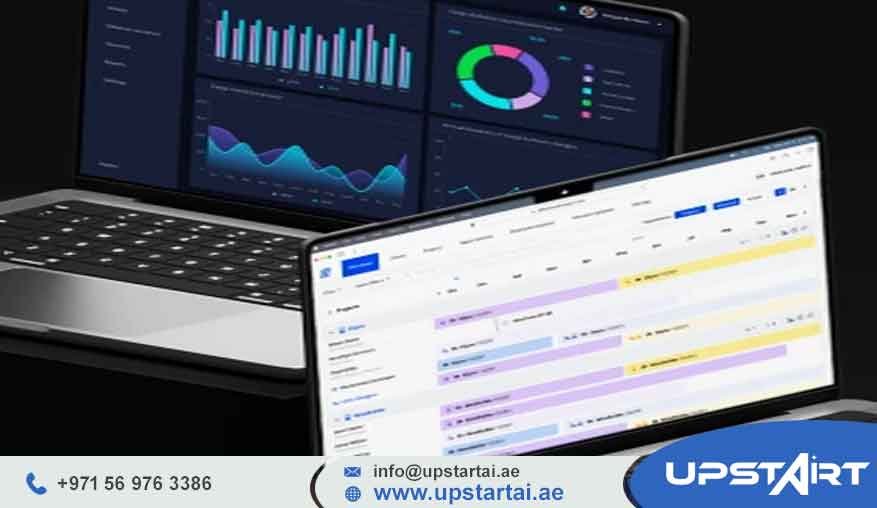
Making business decisions can feel stressful. Too many numbers, too many reports, and still not enough clarity. That’s where smarter data visualization comes in. With easy-to-understand business intelligence dashboards, real time data dashboards, and interactive analytics dashboards, companies can finally see what’s really going on and act with confidence.
At Upstart AI, we help businesses turn messy and confusing data into something useful. Our data analytics visualization and visual analytics for business are built for leaders who want control, clarity, and results they can actually measure. From BI reporting and visualization to AI automation, ERP system development, and big data intelligence, we support companies across the UAE in turning complex information into actionable data insights that make sense.
Want to see how it works. Request a free demo or book a consultation today. Let’s build an analytics solution that supports real business outcomes, not just fancy charts.
Companies trust Upstart AI because we focus on reliability and long-term value. Our team brings together experienced data analysts, AI engineers, and ERP specialists to deliver strategic data visualization. This supports executive dashboards, KPI visualization for companies, and decision intelligence tools that work across the entire organization.
Why Smarter Data Visualization Really Matters Today
Running a business today isn’t easy. Leaders are expected to make quick decisions, keep costs under control, and stay ahead of competitors all at the same time. But many companies are still stuck with outdated reports, static spreadsheets, and insights that arrive way too late. These don’t show what’s happening right now, and that can be risky.
When there’s no clear visibility, decision making becomes guesswork. Teams miss opportunities, processes slow down, and problems grow quietly in the background. Smarter data visualization helps fix this by bringing business intelligence dashboards, data analytics visualization, and visual analytics for business together in one place.
When done right, teams can track KPIs in real time, spot trends early, and make decisions using reliable and up to date information. In fast moving markets like the UAE, strategic data visualization isn’t just a nice to have anymore. It’s essential for growth, efficiency, and confident leadership.
The Problem With Traditional Reporting and BI Tools
A lot of organizations invest heavily in collecting data. But collecting data and actually using it well are two very different things. Traditional BI reporting and visualization often add confusion instead of clarity. Reports come late, dashboards don’t match business goals, and valuable insights stay buried in raw numbers.
It’s common to see data spread across ERP systems, CRMs, and different operational tools that don’t talk to each other. Manual reporting eats up time and energy, and dashboards often lack the context executives really need. This leads to frustration, especially when teams don’t fully trust the data they’re seeing.
All of this puts pressure on leadership, slows down strategy, and increases the chance of bad decisions. Smarter data visualization solves these issues by bringing data together, automating insights, and delivering interactive analytics dashboards that fit different roles and needs.
So What Exactly Is Smarter Data Visualization
Smarter data visualization is a more advanced way of showing and using business data. It combines analytics, automation, and intelligence into one clear system. This includes business intelligence dashboards, real time data dashboards, and interactive analytics dashboards powered by AI driven insights and strong data architecture.
Unlike basic dashboards that just show numbers, smarter visualization focuses on what actually matters. It connects directly to operational systems, applies analytics models, and presents insights in a way that supports executive dashboards and KPI visualization for companies. The result is quicker understanding, better forecasting, and stronger decision outcomes.
This approach supports decision intelligence tools by turning raw data into clear stories that guide decisions across finance, operations, sales, and strategy.
Why Companies in the UAE Choose Upstart AI
Upstart AI is built for businesses that want dependable and results focused analytics solutions. We don’t believe in one size fits all dashboards. Everything we build is designed around real business goals and how teams actually work day to day.
We offer UAE wide service coverage and fast implementation. Whether you’re in Dubai, Abu Dhabi, Sharjah, Ajman, Ras Al Khaimah, or Fujairah, support is never far away. Our process is transparent, structured, and focused on long term value, not quick wins that fade later.
With experience across data analytics visualization, ERP system development, AI automation, and big data intelligence, we deliver integrated solutions that grow with your business. Security, governance, and performance always come first, while still keeping things flexible for companies that are scaling up.
Our AI and Analytics Services
Analytics Dashboard Development
We design business intelligence dashboards that give real time visibility into what matters most. These dashboards are tailored for executives, managers, and operational teams so everyone sees the right data at the right moment. Our interactive analytics dashboards allow drill downs, trend tracking, and clear KPI visualization for companies in different industries.
Data Analytics and Visualization
Our data analytics visualization services turn raw data into insights you can actually use. Through visual analytics for business, we help uncover patterns, inefficiencies, and opportunities that are easy to miss otherwise. It’s ideal for companies that want actionable data insights without getting overwhelmed.
Big Data Intelligence Solutions
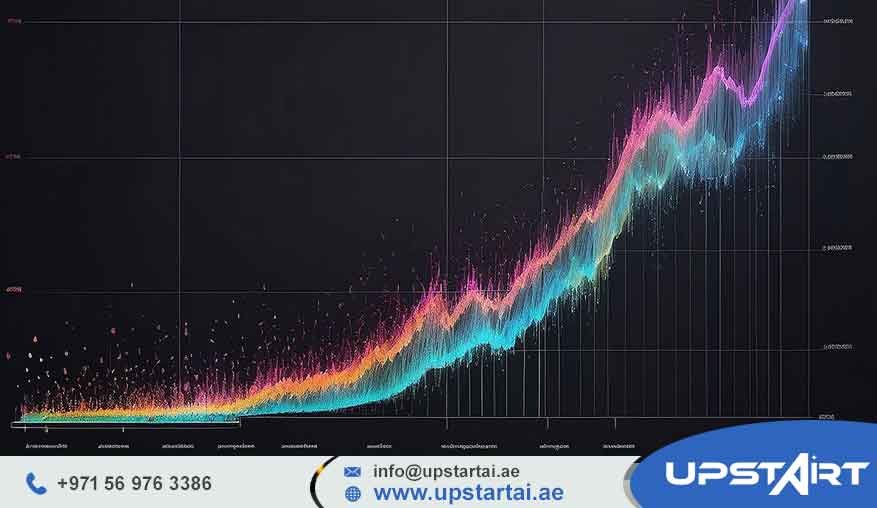
For organizations dealing with large or complex datasets, we offer scalable big data intelligence solutions. These support deeper analytics, historical analysis, and strategic data visualization for long term planning and forecasting.
ERP System Development and Integration
We develop and integrate ERP systems that act as a single source of truth. By embedding BI reporting and visualization into ERP workflows, companies get consistent and reliable insights across finance, operations, and supply chain areas.
AI Automation for Workflows and Operations
Our AI automation services help reduce manual work, improve accuracy, and boost productivity. By automating reporting and operational tasks, teams can spend more time on strategy instead of repetitive work.
Predictive Analytics and Forecasting
We build predictive models that help businesses plan ahead. These enhance executive dashboards and decision intelligence tools by offering forward looking insights based on both historical and real time data.
Custom AI Driven Solutions
No two organizations are exactly the same. That’s why we design custom AI driven solutions based on specific goals, industry needs, and operational challenges.
How Our Process Works
We start with a free consultation to understand your business goals, challenges, and existing systems. Then we perform a data and system audit to check data quality, integration points, and reporting needs.
Next comes solution design. We define dashboards, analytics models, and automation workflows that fit your business. Implementation follows a structured approach to avoid disruption. After that, we test, fine tune, and optimize everything to ensure accuracy and performance.
Ongoing support keeps your analytics dashboards useful as your business evolves. Things change, and your data systems should keep up.
The Problems We Help Solve
Many companies struggle with manual processes, slow reporting, and a lack of actionable insights. Data silos between departments make it hard to see the full picture, and outdated dashboards don’t support good decision making.
Upstart AI fixes this by connecting data sources, automating reporting, and delivering real time data dashboards. Our solutions cut down errors, improve productivity, and help leadership teams move forward with confidence. We help businesses grow without losing control or visibility, which is a big deal honestly.
Pricing and Cost Considerations
The cost of smarter data visualization and analytics depends on a few things. This includes how complex the solution is, the size and type of datasets, customization needs, and project timelines.
Pricing may vary depending on whether you need simple dashboards, full ERP integration, or advanced AI automation. We believe in clear and honest pricing discussions and provide estimates during the consultation stage so there are no surprises later.
Tips to Get the Most Out of Analytics and ERP
To get real value from analytics dashboards, focus on KPIs that match your business goals. Try not to overload dashboards with too many metrics. Clear and actionable insights work best.
For ERP projects, make sure key stakeholders are aligned from the start. Strong data governance helps avoid issues later. When choosing AI automation, target repetitive tasks that take time but don’t add much value. Track ROI by measuring efficiency gains, cost savings, and better decision accuracy over time.
Why Many Companies See Us as a Top Choice
Upstart AI stands out because we combine analytics, ERP development, and AI automation into one complete solution. We focus on results, structured delivery, and close collaboration with clients, not just technology.
We build long term partnerships and provide ongoing support so organizations can adapt as markets and data needs change. That ongoing relationship really matters more than people think.
Real Success Stories
One mid sized retail company was struggling with disconnected sales and inventory data. We implemented business intelligence dashboards and real time data dashboards that helped leadership spot demand trends and improve inventory planning. This led to better efficiency and lower stock related costs.
A services company faced delays in financial reporting due to manual work. By integrating BI reporting and visualization with their ERP system, reporting became faster and forecasting improved.
A logistics focused organization used AI automation and predictive analytics to improve route planning and control costs, all through clearer actionable data insights.
Frequently Asked Questions
How long does it take to set up an analytics dashboard
It depends on complexity but usually takes from a few weeks to a few months
Can dashboards work with existing ERP systems
Yes, we integrate with common ERP platforms and custom setups
Is data security taken seriously
Yes, we follow strong security and data governance practices
Are these solutions good for small businesses
Yes, we work with startups, SMEs, and large enterprises
Do you provide ongoing support
Yes, continuous support and optimization are part of our approach
How is pricing decided
Pricing depends on scope, data volume, and customization needs
Can dashboards be customized for executives
Yes, executive dashboards are designed around leadership priorities
Do you support real time data dashboards
Yes, real time reporting is a core feature
Is AI automation required
No, it’s optional and depends on your needs
Do you offer consultations across the UAE
Yes, we serve all Emirates
Get in Touch and Get Started
Ready to turn your data into better decisions. Reach out to Upstart AI to talk about analytics, ERP, and AI automation solutions. We serve companies across Dubai, Abu Dhabi, Sharjah, Ajman, Ras Al Khaimah, and Fujairah.
Call us, message us on WhatsApp, send an email, or fill out the online form. Book your free consultation and take the first step toward smarter data visualization for your company.
Sources and Verification
The ideas shared here are based on widely accepted practices in business intelligence, data analytics, ERP systems, and AI automation. Definitions and methods align with common industry standards used by leading analytics and BI providers.